Change in Medicine prescription patterns pre-COVID and post-COVID period
Date: March 03, 2024
Research Question:
To what extent did the COVID-19 pandemic impact prescribed medication use patterns in England compared to pre-covid (2018) and post-covid (2023)?
Is there a rise or decrease in prescribed medication between 2018 and 2023?
Are there any vast differences in medications for a particular biological system between 2018 and 2023?
Are there vast differences for a particular medication type between 2018 and 2023?
Are there vast differences for a particular medicine type between 2018 and 2023?
What is COVID-19, and what is its impact on the health of England?
COVID-19, also known as coronavirus, is an infectious disease caused by the SARS-CoV-2 virus (World Health Organization, 2021). The first time COVID-19 was found in CHINA was in late 2019, and by mid-2020, it become a worldwide pandemic. In early 2020, the first case of COVID-19 was recorded in the UK. By the middle of April 2020, the first wave of COVID-19 was at its peak in the UK, with an average of 4.5 K daily cases, 185 K active cases and 1.3K daily deaths (Worldometer, 2024). The Second wave of the coronavirus was more deadly to the people of the UK. It was at its peak in early 2021. The 2nd wave of COVID-19 Killed almost 100k people in the UK at this time, and the daily deaths increased by 1.3k. By the end of 2022, the daily cases were reduced to 5k, and in the next few months, it was reduced to fewer new cases or zero (Worldometer, 2024).
Covid-19 was a pandemic which left everyone with permanent to temporary mental and physical damage. This study focuses on finding the trends in the usage of medicines and the drug types and targeted biological systems based on the data of 2018-19 compared with 2023-24.
Table 1: Statistics of Covid in the UK.
| Total Number of Cases: | 24.9 million |
| Total Number of Deaths: | 232.1 thousand |
| Total Number of Recoveries: | 22.9 million |
| Current Infection rate (2023): | 2.7% |
*(Office for National Statistics, 2022)
Data Acquisition:
Data Source:
The data is taken from the NHS Open Data portal. From January 2023 to December 2023, data will be collected from the new data warehouse: https://opendata.nhsbsa.net/dataset/prescription-cost-analysis-pca-monthly-data.
Whereas January 2018 to December 2018 data is taken from the older data warehouse: https://www.nhsbsa.nhs.uk/prescription-data/dispensing-data/prescription-cost-analysis-pca-data
Why 2018 data and 2023 data?
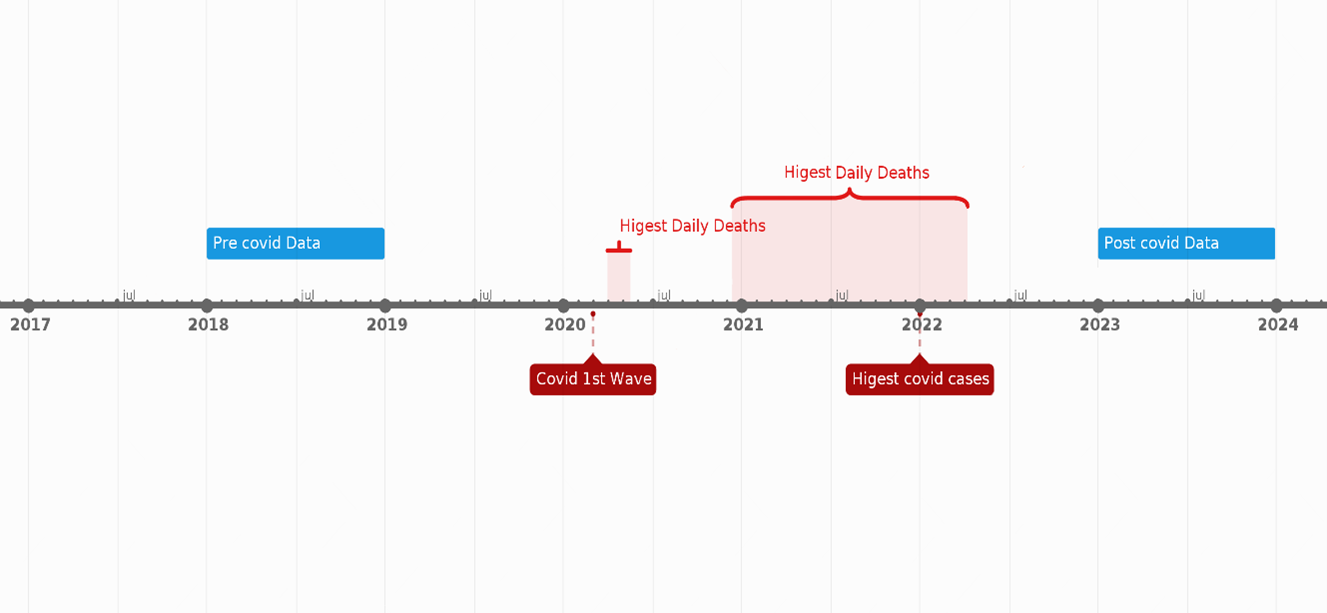 Fig 1: Dataset consideration based on the timeline of COVID-19.
As shown in Fig 1, COVID-19 started at the end of 2019, and the first COVID wave in the UK was in 2020. Hence, the 2018-19 data is suitable for analysing the pre-COVID period, and the latest data available is 2023-24, which can be considered post-COVID data for the analysis.
Dataset Description:
The Prescription Cost Analysis (PCA) Monthly Administrative Data is the dataset provided by NHS. It contains information on all prescription items dispensed in the community in England monthly and submitted to the NHS for reimbursement. These statistics are designed to provide the total number of prescription items and spending for any individual product at any level of the British National Formulary (BNF) hierarchy. This data is collected from submitting prescriptions to the NHS by dispensing contractors. These prescriptions are issued by GPs and other authorised prescribers such as nurses, dentists, and allied health professionals.
The Dataset contains the following columns:
Table 2: Description of Attributes present in the dataset.
| Columns (2018 Dataset) | Columns (2023 Dataset) | Title | Type | Description | ||
|---|---|---|---|---|---|---|
| YEAR_MONTH | Year and Month as YYYYMM | number | Example: 201401 | |||
| REGION_NAME | Regional Office Name | string | The name is given to a geographical region by NHS England. | |||
| REGION_CODE | Regional Office Code | string | The unique code used to refer to a Regional Office. | |||
| ICB_NAME | Integrated Care Board (ICB) Name | string | The name is given to a geographical statutory organisation by NHS England. | |||
| ICB_CODE | Integrated Care Board (ICB) Code | string | The unique code is used to refer to an ICB. | |||
| DISPENSER_ACCOUNT_TYPE | Type of English dispensing contractor | string | Categorises the type of English dispensing contractor. | |||
| BNF CODE | BNF_PRESENTATION_CODE | British National Formulary (BNF) Code | string | The unique code used to refer to a BNF Presentation. | ||
| Drug Name | BNF_PRESENTATION_NAME | British National Formulary (BNF) Name | string | The name is given to a drug or an appliance’s specific type, strength, and formulation. | ||
| SNOMED_CODE | Presentation SNOMED Code | string | A unique identifier for each Medicinal Product. | |||
| SUPPLIER_NAME | Supplier Name | string | The manufacturer, supplier, or wholesaler of the product. | |||
| UNIT_OF_ MEASURE | Unit of Measure | string | The pharmaceutical form or unit measures a sole product unit (e. | g. | , tablet). | |
| GENERIC_BNF_EQUIVALENT_CODE | Generic Equivalent BNF Code | string | The unique code refers to the generic equivalent of the BNF Presentation. | |||
| GENERIC_BNF_EQUIVALENT_NAME | Generic Equivalent BNF Name | string | The name was given to the generic equivalent of BNF Presentation. | |||
| BNF_CHEMICAL_SUBSTANCE_CODE | BNF Chemical Substance Code | string | A unique code used to refer to a BNF Chemical Substance. | |||
| BNF Chemical Name | BNF_CHEMICAL_SUBSTANCE | BNF Chemical Substance Name | string | The name of the main active ingredient in a drug. | ||
| BNF_PARAGRAPH_CODE | BNF Paragraph Code | string | The unique code is used to refer to a BNF paragraph. | |||
| BNF_PARAGRAPH | BNF Paragraph Name | string | The name is given to a BNF paragraph within the BNF classification system. | |||
| BNF_SECTION_CODE | BNF Section Code | string | The unique code refers to a BNF section. | |||
| BNF_SECTION | BNF Section Name | string | The name is given to a BNF section within the BNF classification system. | |||
| BNF_CHAPTER_CODE | BNF Chapter Code | string | The unique code refers to a BNF chapter. | |||
| BNF_CHAPTER | BNF Chapter Name | string | The name given to a BNF chapter is the broadest grouping within the BNF classification system. | |||
| Preparation Class | PREPARATION_CLASS | Preparation Class | string | The NHSBSA classification for drugs, appliances, and medical devices. | ||
| Prescription Class | PRESCRIBED_PREP_CLASS | Prescribed Preparation Class | string | The NHSBSA classification of the prescribed product. | ||
| ITEMS | Items | number | The number of times a product appears on a prescription form. | |||
| Quantity | TOTAL_QUANTITY | Total Quantity | number | The total quantity of a drug or appliance prescribed. | ||
| Net Ingredient Cost | NIC | Net Ingredient Cost (NIC) | number | The amount paid using the basic price of the product. | ||
| PHARMACY_ADVANCED_SERVICE | Pharmacy Advanced Service | string | A flag identifying if an advanced pharmacy service was used for the dispensed item. |
Data Preparation:
Initially, data is semi-organized and uncleaned. There are many unwanted attributes and records present. The dataset is provided so that only one month is present in one file. It is also necessary to bring all the 2018 January to December data in one CSV file and the 2023 January to December data in one CSV file. R programming language cleans and transforms these files in the desired format.
Initial preparation:
All the files for the year 2018 are in Excel format, and they have two sheets. Initially, all the files are converted to CSV using Microsoft Excel.
Missing Values:
As shown in Fig 2, some values in the Dataset for BNF Chemical Name need to be added. The chemical name is optional for the analysis, but these missing values are only for preparation class 4, as shown in Fig 3. As per (NHS Digital, n.d.), there are many instruments and materials used by the NHS, like cotton, Bandages, etc., which are not medicines and are classified as Preparation Class 4. For this analysis, we do not need these things; hence, these are dropped, as shown in Figure 5.
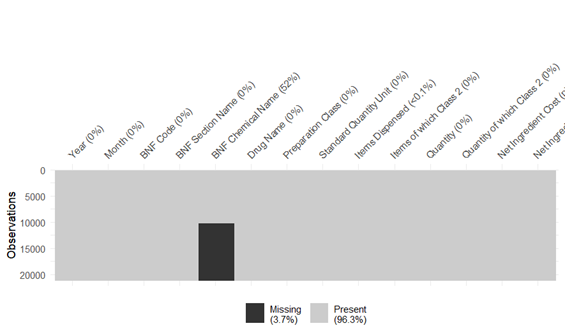 Fig 2: Missing Values in Dataset
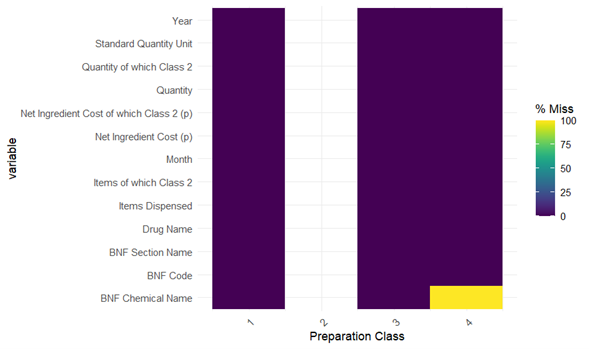
Fig 3: Missing Values is related to Preparation Class 4
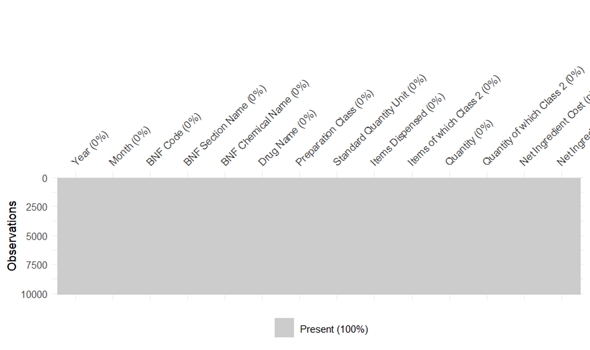
Fig 4: Dataset with missing Values cleaned.
Feature Engineering:
Both datasets are present in different data warehouses, so transformation is done to bring the year’s data in the same format. As per (NHS Digital, n.d.) BNF CODE or BNF_PRESENTATION_CODE is the primary key made in the following ways:
- characters 1 and 2 show the BNF chapter.
- 3 and 4 show the BNF section.
- 5 and 6 show the BNF paragraph.
- 7 shows the BNF sub-paragraph.
- 8 and 9 show the chemical substance.
- 10 and 11 show the product.
- 12 and 13 show the strength and formulation.
- 14 and 15 show the equivalent.
So, characters 1,2,3,4,5,6 and 7 are used to create BNF_CHAPTER, BNF_SECTION, and BNF_PARAGRAPH columns in the 2018 dataset. Figs 5 and 6 show the dataset before and after new columns were added to the 2018 dataset.
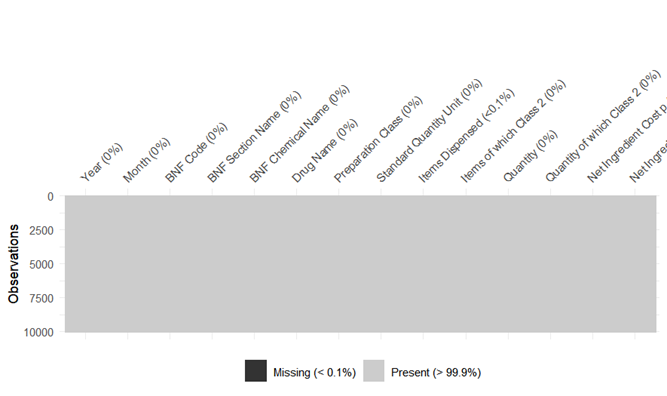 Fig 5: Before adding new columns to the 2018 dataset.
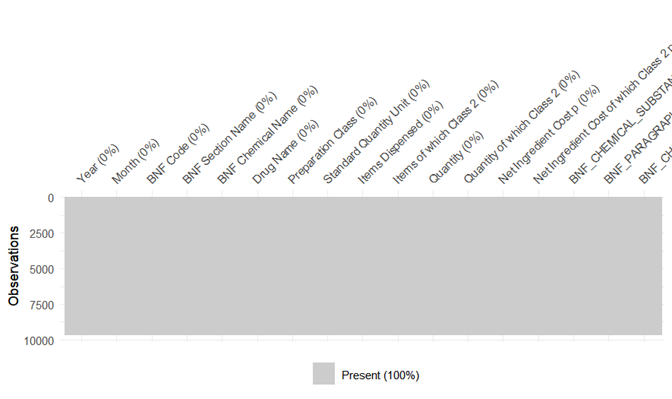
Fig 6: After adding new columns to the 2018 dataset.
#3 Feature selection:
So many columns in the 2018 and 2023 datasets must be removed per the data analysis requirement. As shown in Table 3. The following attributes are kept in the dataset. Figs 7 and 8 represent the dataset for 2018 and 2023 after feature selection.
Table 3: Columns kept for data analysis.
| Column (2018 Dataset) | Column (2023 Dataset) | Title | Type | Description |
|---|---|---|---|---|
| Year | YEAR | Year as YYYY number | Example: 2018 | Month MONTH Month as MM number Example: Jan |
| BNF CODE | BNF_PRESENTATION_CODE | British National Formulary (BNF) Code | string | The unique code used to refer to a BNF Presentation. |
| Drug Name | BNF_PRESENTATION_NAME | British National Formulary (BNF) Name | string | The name is given to a drug or an appliance’s specific type, strength, and formulation. |
| BNF Chemical Name | BNF_CHEMICAL_SUBSTANCE | BNF Chemical Substance Name | string | The name of the main active ingredient in a drug. |
| BNF_PARAGRAPH | BNF_PARAGRAPH | BNF Paragraph Name | string | The name is given to a BNF paragraph within the BNF classification system. |
| BNF_SECTION | BNF_SECTION | BNF Section Name | string | The name is given to a BNF section within the BNF classification system. |
| BNF_CHAPTER | BNF_CHAPTER | BNF Chapter Name | string | The name given to a BNF chapter is the broadest grouping within the BNF classification system. |
| Quantity | TOTAL_QUANTITY | Total Quantity | number | The total quantity of a drug or appliance prescribed. |
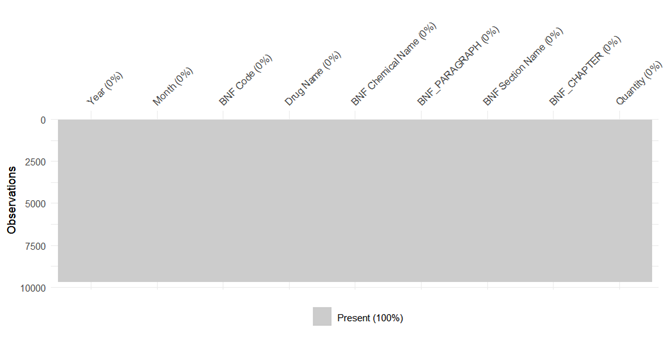
Fig 7: Selected features for the 2018 dataset.
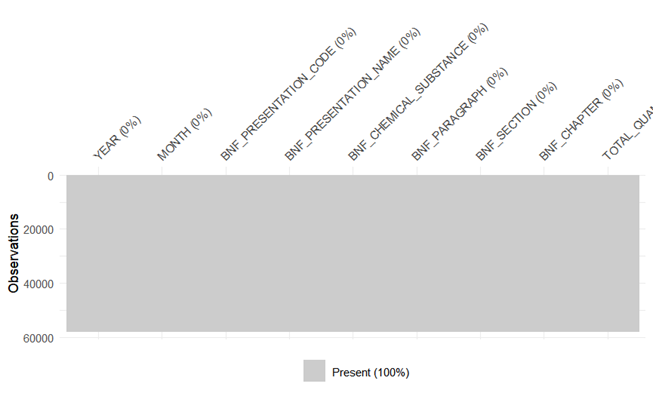
Fig 8: Selected features for the 2023 dataset.
Data Consolidation:
For each month, there is a separate CSV file. Data Consolidation is applied to work on it, and all data is merged into a single CSV file for both 2018 data and 2023 data.
Exploratory Data Analysis:
Microsoft Power BI is used for exploratory data analysis. It is one of the most used data visualisation tools in many industries. Medications are divided into chapters (Biological system), sections (Medication types) and paragraphs (Medicine types), and their quantities are mentioned in the prescriptions (Fig 9). There are more levels of data available but not considered.
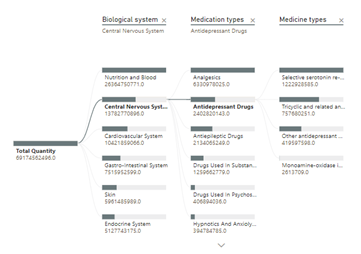
Fig 9: Structure of medicine division into sections and sub-sections.
Basic Statistics of Datasets:
As shown in Fig 9: For the Pre-COVID Dataset (2018 Dataset), We have 236 thousand recorded prescriptions, and the Total quantity of medicines sold was 77.8 billion. The total number of biological systems (BNF Chapters) treated was 20. 199 types of medication (BNF Section) were used in 2018, and 368 different categories of medicines (BNF Paragraph) were prescribed. On the other hand, As shown in Fig 10, in the post-COVID (2023 dataset), We have 6.8 million recorded prescriptions, and the Total quantity of medicines sold was 99 billion. The total number of biological systems (BNF Chapters) treated was 21. 202 types of medication (BNF Section) were used in 2023, and 425 different categories of medicines (BNF Paragraph) were prescribed.
Both datasets have different numbers of prescriptions, and the quantity sold also differs. For the comparison, only the same type of biological system, Medication type and medicine types are considered. The ratio of shares by a biological system in total quantity sold is considered when comparing pre-and post-COVID periods.
 Fig 9: Statistics for the 2018 dataset.

Fig 10: Statistics for the 2023 dataset.
Comparison of Pre-COVID and Post-COVID periods.
For comparison, only the top 6 prominent categories are chosen for the analysis. Fig 11 provides a comparative comparison of medication sold by biological systems in the pre- and post-COVID eras. While the overall market expanded significantly between 2018 and 2023, the relative proportions of quantity sold per biological system also shifted. Notably, the Central Nervous System category maintained its dominant position.
On the other hand, medication for the central nervous system and cardiovascular systems is reduced. However, in 2023, Appliances emerged as one of the top-selling categories after being a less prominent segment in 2018, indicating a substantial growth trajectory. This shows that after COVID-19, technological advancements in medical devices increased. It also revealed that more people now rely on at-home healthcare solutions or the evolving needs of patients in the post-pandemic landscape.
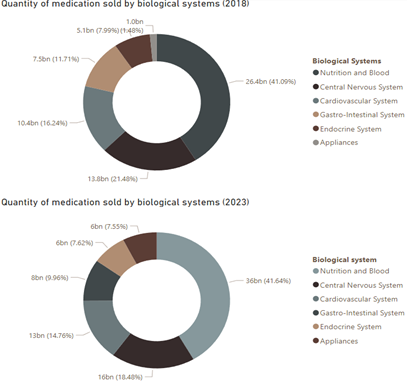
Fig 11: Change in medicines sold based on the biological system.
Going one level deeper gives more insights. As shown in Fig 12, Under medication types, oral nutrition is the most dominant in 2018 and 2023. Still, in 2023, enteral nutrition is also dominant, showing that in 2023, more people have gone through tube feeding, which might be linked to an increase in critical care cases or chronic conditions. On the other hand, Drugs used in diabetes and antidepressants show a modest increase, reflecting the growing prevalence of chronic diseases. Other medication types showed consistent demands.
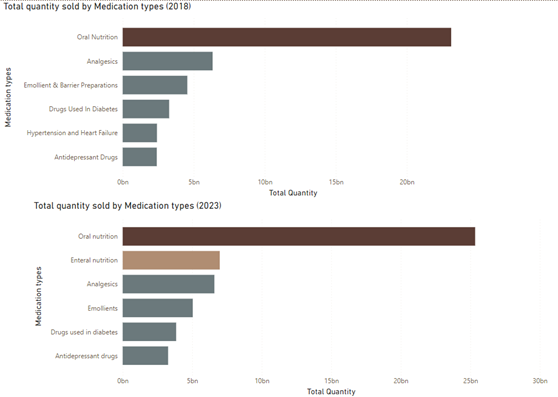
Fig 12: Change in medicines sold based on the medication type.
Further analysis is needed to go one step deeper into the details. So, an analysis is done on the medicine types and the quantity sold for 2018 and 2023. In 2023, there were some changes, and foods for special diets were named ONS-standard. In Fig 13, the amount of special food increased drastically, implying that after COVID-19, more dietary issues were raised. Similarly, skin care (emollients) also increased post-COVID time, showing more skin problems. This may be linked to the lockdown, and staying at home may have reduced the tolerance power of the skin. There was also a constant rise in Antidepressants and Antidiabetic drugs, showing an increase in chronic diseases after COVID-19.
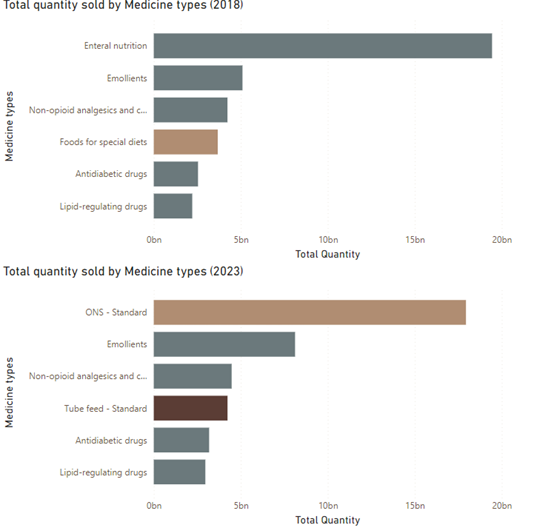
Fig 13: Change in medicines sold based on the medication type.
Both 2018 and 2019 have similar sets of medicines, but the quantity is different. So, to Accurately analyse the change, a measure is created in Power BI to compute the relative difference in quantity between the two years, expressing it as a percentage. This allows for comparison and analysis of the rate of change. As shown in Fig 14, the use of Stoma appliances increased by 1700%, which shows that in the post-COVID period, the incidence of inflammatory bowel diseases increased at a very high rate. There is a rise of 325% in Incontinence appliances, which shows that urine diseases have also increased at an alarming rate. In general, the use of appliances also increased by 570%, showing growth and adaptation of technologies in the medical field. On the other hand, anaesthesia and dressing also increased at a relatively average rate. Regarding medicine type, skin fillers and protectives have increased by more than 900%, indicating people are more conscious about their looks and skin care after COVID-19. Adhesive removers grew by more than 300%, indicating that hygiene awareness has increased after COVID-19.
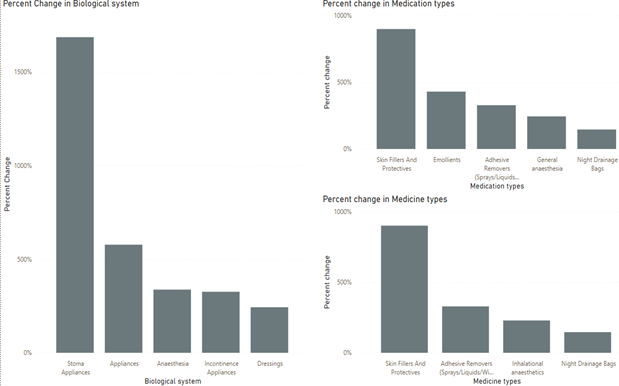
Fig 14: per cent change in quantity sold in 2023 compared to 2018.
Conclusion:
The COVID-19 pandemic significantly impacted prescribed medication use patterns in England. Overall, medication consumption substantially increased from 2018 to 2023. However, the impact was not uniform across all drug categories. While some medication types, such as appliances, experienced exponential growth, likely due to increased reliance on at-home care and the emergence of new medical technologies, others showed more modest changes. Notably, the relative proportion of medications within different biological systems shifted, indicating alterations in treatment priorities. These findings suggest a complex interplay between the pandemic, evolving healthcare practices, and changing patient needs. Key Insights:
- Prescriptions increased: 236K in 2018 to 6.8M in 2023.
- Medicines sold surged: 77.8B units in 2018 to 99B in 2023.
- Appliances boomed: Emerged as a top category with substantial growth.
- Enteral nutrition rose, Indicating a potential increase in critical care or chronic conditions.
- Special foods surge: Implying more dietary issues post-COVID.
- Stoma appliances soared: Increased by 1700%, indicating a rise in inflammatory bowel diseases.
- Skincare products spiked: Increased by over 900%, reflecting increased focus on appearance.
Justification of Visualizations:
Charts used:
Decomposition tree: In
Fig 9, the Decomposition tree is used. The decomposition chart effectively represents the hierarchical structure of medication data.Doughnut chart: In
Fig 11, Doughnut charts are used. The doughnut chart provides a concise visual comparison of market shares across biological systems over time, emphasising the impact of COVID-19 on the medication prescribed.Stacked bar chart: Stacked bar charts are used in
Fig 12 & 13. The stacked bar chart provides a clear and concise visual representation of medication-prescribed trends, enabling viewers to identify critical changes and insights quickly.Stacked column chart: in
Fig 14, a Stacked column chart is used. The stacked column chart provides a clear and concise visual representation of the percentage change in medication types and biological systems, enabling viewers to identify key trends and insights quickly.Colours used:
More than 2.2 billion people are visually impaired, including 300 million with colour vision deficiency (CVD). Colour blindness is more prevalent in men, with 8% affected compared to 0.5% of women (powerbi.microsoft.com, n.d.). To overcome this challenge, the “Accessible neutral” theme from Power BI was used.
Typography used:
Research by (Bernard et al. 2001) indicates that different fonts influence information processing speed. As such, careful font choice is crucial for effective chart design. All visualisations are made using Segoe UI and DIN Fonts. Segoe UI is a sans-serif font, often considered clean, modern, and neutral (nihar, 2022). Din is a geometric sans-serif font typically associated with industrial design and often perceived as bold and robust (farnbeyond, 2012).
References:
Bernard, M., Liao, C. and Mills, M. (2001), March. The effects of font type and size on the legibility and reading time of online text by older adults. In CHI’01 extended abstracts on Human factors in computing systems (pp. 175-176).
farnbeyond (2012). Typographic Design Poster Series - No 002 DIN Typeface Far’n’Beyond. [online] FarnBeyond Design Print Digital. Available at: https://www.designprintdigital.com/blog/typography/typographic-poster-series-002-din/#:~:text=DIN%20stands%20for%20Deutsches%20Institut [Accessed 28 Jul. 2024]. NHS Digital. (n.d.). Practice level prescribing - glossary of terms. [online] Available at: https://digital.nhs.uk/data-and-information/areas-of-interest/prescribing/practice-level-prescribing-in-england-a-summary/practice-level-prescribing-glossary-of-terms#bnf-code-structure.
nihar (2022). Segoe UI font family - Typography. [online] learn.microsoft.com. Available at: https://learn.microsoft.com/en-us/typography/font-list/segoe-ui.
Office for National Statistics (2022). Coronavirus (COVID-19) latest insights - Office for National Statistics. [online] www.ons.gov.uk. Available at: https://www.ons.gov.uk/peoplepopulationandcommunity/healthandsocialcare/conditionsanddiseases/articles/coronaviruscovid19/latestinsights.
powerbi.microsoft.com. (n.d.). Create stunning and more accessible reports in minutes with our new color themes! [online] Available at: https://powerbi.microsoft.com/en-us/blog/create-stunning-and-more-accessible-reports-in-minutes-with-our-new-color-themes/ [Accessed 28 Jul. 2024].
Worldometer (2024). United Kingdom Coronavirus - Worldometer. [online] www.worldometers.info. Available at: https://www.worldometers.info/coronavirus/country/uk/.
- World Health Organization (2021). Coronavirus Disease (COVID-19). [online] World Health Organization. Available at: https://www.who.int/health-topics/coronavirus#tab=tab_1.